


[Images by BUILD LLC]
One of the first steps of researching a project here at BUILD is generating a clear set of diagrams. This is all the more important for larger, more complicated project types. Diagrams can address everything from existing site conditions, to building code provisions, and how the clients need the architecture to function. Most importantly, they filter down what is typically an overwhelming amount of information down to what matters most.
Lately, the scale of work around BUILD World Headquarters has seen an increase in size and complexity, putting our philosophy and methodology of diagramming to the test. The more variables on a project and the denser the data, the more relevant a good set of diagrams becomes. Successful ones should demonstrate a clear pathway for the client and design team, and embody the most important design drivers on a project. The process of design, permitting, and construction is lengthy and complicated, and these diagrams provide the team with a valuable reference point throughout the timeline. Today’s post covers three projects and how the diagramming strengthens the design process.
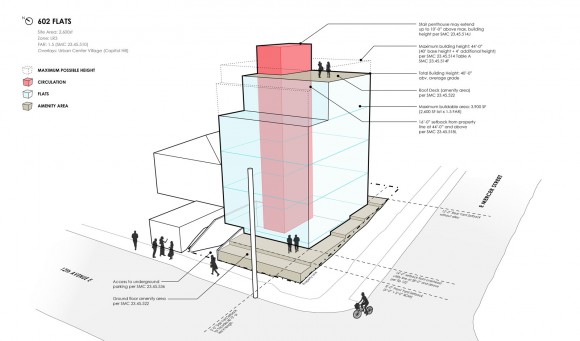
602 FLATS
Working in land use zones that allow for densities greater than the single family zones often involves more complicated setbacks. The maximum possible building envelope of this multi-family building is limited by layers of setbacks introduced at different heights. Throw in another layer of clearances for nearby power lines, requirements for ground floor amenity areas, and floor area ratios, and it’s difficult to envision the architectural possibilities without a diagram. The example below becomes an important tool the clients and the design team use to understand the building code and optimize the architecture.
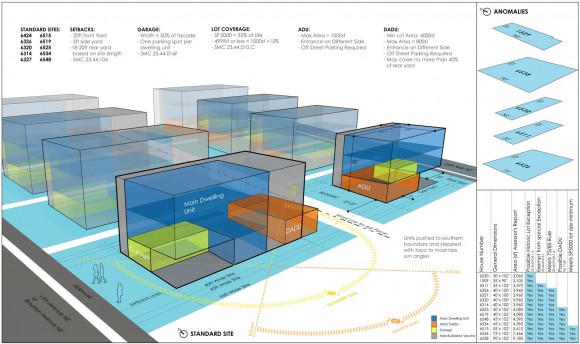
ROOSEVELT HOUSING
The next diagram is a mapping of 15 single family residential lots within close proximity to one another. The intent of the study is to identify the lots which share a set of common denominators, making them prime candidates for a model of repetitive housing. The results are 10 lots which all share multiple characteristics while meeting certain thresholds for permitting. It also identifies five unique lots which may not lend well to the repetition, but can still accommodate housing. The study goes on to illustrate different massing options available to the 10 standard lots which introduce variation and character to the individual houses.
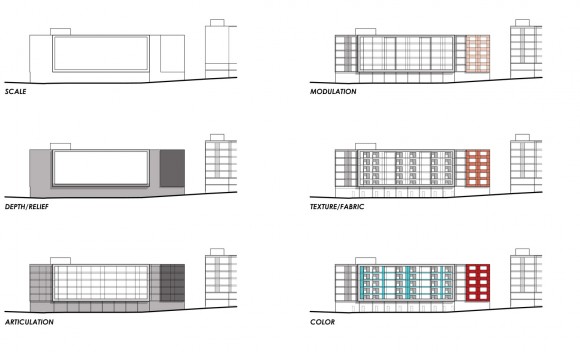
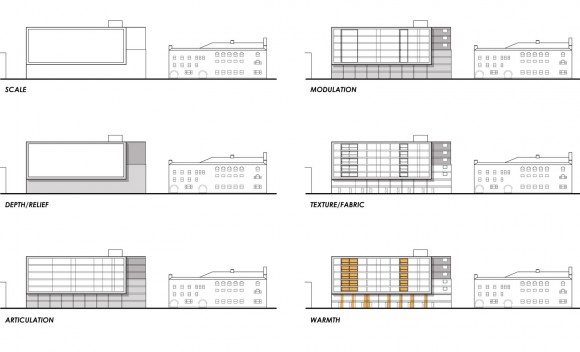
FIRST CENTRAL STATION
The elevation studies below distill a series of intricate design moves on a mixed-use project to their fundamental steps. Diagramming each architectural move, from one logical step to the next, illustrates the thinking at work and presents the final design as a series of strategic and rational decisions instead of purely artistic vision. This series provides a language the design team can use to share the exploratory process with the community.
At its core, diagramming is about communication. It offers a succinct format for digesting a dense set of data understandable to anyone who comes across the graphics, regardless of their familiarity with the project. And the best ones are beautiful, functional, and referenced throughout the life of a project and even beyond.
Cheers from Team BUILD